
.png)


Unsupervised Machine Learning Classification of Stellar Populations in Open Clusters Using Gaia DR3 Photometry and Astrometry

Updated: Aug 29
Author: Nischal Shah
Abstract
Open clusters are gravitationally bound stellar families sharing common origin, age, and distance, making them natural laboratories for testing stellar evolution theory and tracing galactic structure. Large-scale classification of cluster stellar populations has historically required expensive spectroscopic observations that are unavailable for most clusters detected by the Gaia mission. Using Gaia Data Release 3 (DR3) photometry and astrometry, a four-cluster pilot study retrieved 714,540 stars, of which 5,409 were retained as confirmed members. Colour-magnitude diagrams revealed a clear age-dependent main sequence turn-off progression, with Praesepe (700 Myr) terminating at an absolute magnitude of approximately 1, while NGC 2516 (150 Myr) extends to approximately -4, demonstrating that unsupervised machine learning applied to Gaia photometry and astrometry can recover stellar age signatures. Four independent clustering algorithms - k-means, DBSCAN, Gaussian Mixture Models, and Self-Organising Maps - were applied to a five-dimensional feature space comprising colour, absolute magnitude, parallax, and proper motion. All four methods independently confirmed an upper/lower main sequence division as the dominant structural feature, with the Gaussian Mixture Model further resolving five to six components corresponding to distinct stellar mass regimes. Self-Organising Map U-matrices revealed genuine density discontinuities in five-dimensional feature space across all four clusters. Giant and supergiant candidates in NGC 2516 were spontaneously detected at absolute magnitudes of -4 to -2, consistent with the cluster's age, and white dwarf candidates were identified across multiple clusters. PARSEC isochrone overlays at literature ages confirmed pipeline reliability and physically consistent cluster membership across all four targets. These results demonstrate that unsupervised classification using Gaia photometry and astrometry can recover physically meaningful stellar population structure, enabling scalable analysis across the thousands of open clusters in the Gaia catalogue.
Introduction
Open clusters are gravitationally bound stellar families sharing common origin, age, and distance. They serve as essential tracers of the structure and history of the Galactic disc[1]. Gaia-based searches have expanded their census to 7,167 clusters, of which 2,387 are candidate new objects and 4,782 crossmatch to objects already known in the literature, including 134 globular clusters[2]. The current scale of data, comprising over 1.8 billion sources, is valuable because it allows a fully homogeneous analysis across the entire sky, eliminating discrepancies that arise from combining separate ground-based studies[1,3].
Astronomers have traditionally relied on proper motion models to separate cluster stars from field stars[4], and on morphological age indices based on luminosity and colour differences in colour-magnitude diagrams (CMDs)[5]. High-resolution spectroscopy is required for accurate metallicity and chemical abundance determination, yet it is costly and time-consuming; fewer than 5% of known open clusters have been studied using high-resolution spectroscopy[1]. When these methods are scaled to thousands of clusters, inhomogeneous analysis using different data and methods leads to conflicting and discrepant cluster parameters[1]. Manual isochrone fitting and outlier removal also become impractical and prone to human bias when applied to the volume of data produced by modern surveys[2,3]. There is a lack of systematic identification of population substructure across multiple clusters simultaneously[3,6], and current methods still struggle to reliably distinguish bound open clusters from unbound moving groups on a large scale[2].
No study has yet systematically applied multiple unsupervised machine learning algorithms simultaneously to characterise internal stellar population substructure across a sample of open clusters spanning a wide age range, using photometry alone[6,1]. Earlier work established a list of members and derived mean parameters for 1,229 open clusters using Gaia DR2 data and the UPMASK algorithm[1], while a more recent blind all-sky search recovered 7,167 clusters using the HDBSCAN algorithm on Gaia DR3 data, though without yet classifying these as gravitationally bound or unbound[2]. Other studies have identified clusters as overdensities in multi-dimensional astrometric space comprising position, proper motion, and parallax, though their primary limitation is that the density parameter must often be set globally, which can reduce sensitivity in regions of varying stellar density[6,2]. Self-Organising Maps have not previously been applied systematically to open cluster stellar population substructure[7]; while the Gaia DR3 'Outlier Analysis' module uses Self-Organising Maps to group similar spectra, this is used to flag objects that do not fit standard categories rather than to map internal cluster substructure[3].
This study uses the Gaia DR3 dataset, which provides the largest collection of all-sky spectrophotometry and homogeneous astrophysical parameters for hundreds of millions of sources. Four algorithms were selected to represent the four principal families of unsupervised clustering: k-means (centroid-based, providing a universal baseline), DBSCAN (density-based, identifying groups automatically and handling outliers without prior assumptions), Gaussian Mixture Models (probability-based, resolving overlapping populations and selecting model complexity via the Bayesian Information Criterion), and Self-Organising Maps (neural-network-based, mapping continuous structure across the full five-dimensional feature space). Most open cluster machine learning studies to date have used only one or two algorithms and have analysed clusters individually. This study addresses that gap by applying four algorithms from four distinct mathematical families - centroid, density, probabilistic, and neural network - simultaneously to the same set of clusters across a wide age range, with cross-method validation as an explicit aim. The study recovers a systematic age-dependent main sequence turn-off progression across all four clusters, spontaneously detects giant, supergiant, and white dwarf candidates as pipeline by-products, and demonstrates through cross-method validation that algorithm choice determines the resolution at which stellar substructure can be detected. The remainder of this paper describes the data and quality cuts used (Method), reports the results of each clustering approach (Results), discusses their physical interpretation (Discussion), and summarises the conclusions drawn (Conclusion).
Literature Review
Gaia Data Release 3 is the third major update from the European Space Agency's Gaia mission, published in 2022. It provides a five-parameter astrometric solution (position, parallax, and proper motion) alongside photometry in three bands for over 1.4 billion sources, and is the most precise large-scale stellar catalogue currently publicly accessible. Because it combines photometric and astrometric data in a single catalogue, it supports membership determination through proper motion filtering and has been validated extensively in the literature for open cluster studies. Prior approaches to cluster membership and substructure detection - including UPMASK, HDBSCAN, and density-based overdensity searches in astrometric space - have each made substantial progress, but no prior study has combined four structurally distinct unsupervised algorithms on the same cluster sample with the explicit goal of cross-validating the resulting substructure. This gap motivates the approach taken in this study.
Method
Data Collection
Data were queried using astroquery, a Python library that interfaces directly with the Gaia archive via the Astronomical Data Query Language (ADQL). Each query targeted a circular sky region centred on a cluster's known coordinates, retrieving source identifier, right ascension, declination, parallax, parallax error, proper motion in both coordinates, mean G-band magnitude, BP-RP colour, and the renormalised unit weight error (RUWE). Queries were submitted as asynchronous jobs to handle large result sets. Four open clusters were selected for this pilot study: Pleiades (approximately 125 Myr, 135 pc), Praesepe (approximately 700 Myr, 187 pc), NGC 2516 (approximately 150 Myr, 407 pc), and Blanco 1 (approximately 100 Myr, 237 pc). These clusters span a seven-fold age range and a range of distances, allowing both an age-dependent comparison and a test of pipeline robustness across different observational conditions. They were chosen because they are nearby, well-studied benchmark clusters with established membership lists and literature parameters, enabling reliable validation of the pipeline against known values.
Quality Cuts and Membership Determination
Stars were filtered using five sequential quality cuts. First, sources with a parallax error exceeding 10% of the parallax value were removed to ensure reliable distance measurement. Second, sources with RUWE greater than 1.4 were removed, as such values indicate that the single-star astrometric model failed to fit the source reliably. Third, sources missing any of the five key measurements (parallax, BP-RP, G-band magnitude, or either proper motion component) were removed, as incomplete entries cannot be used in CMD construction or the machine learning feature space. Fourth, a parallax cut was applied using cluster-specific windows centered on literature values. Fifth, proper motion cuts were applied using cluster-specific windows, with a tolerance of ±3.0 mas/yr in each dimension. Table 1 summarises the initial and final star counts of this pipeline.
Cluster | Raw | Final | Retention (%) |
Pleiades (M45) | 219,733 | 1,055 | 0.48 |
Praesepe (M44) | 131,567 | 921 | 0.70 |
NGC 2516 | 313,510 | 2,836 | 0.91 |
Blanco 1 | 49,730 | 597 | 1.20 |
Total | 714,540 | 5,409 | 0.76 |
Table 1: Initial and final star counts for the selected open clusters. Raw counts reflect all sources returned within the search cone. Final counts reflect confirmed cluster members after the application of all five quality cuts.
Feature Space Construction
Absolute magnitude was computed from apparent G-band magnitude and parallax-derived distance using the standard distance modulus, where distance in parsecs is one thousand divided by the parallax in milliarcseconds. The colour index BP-RP was taken directly from Gaia DR3 photometry. CMDs were constructed for each cluster individually and as a four-cluster comparative overlay. The five-dimensional feature space used in all subsequent machine learning analyses comprised BP-RP, absolute magnitude, parallax, and the two components of proper motion. All features were standardised to zero mean and unit variance prior to clustering using z-score normalisation, to prevent high-variance features from dominating the distance calculations used by each algorithm.


Figure 1: Colour-magnitude diagrams for all four open clusters on a common absolute magnitude scale. Main sequence, turn-off region, and outlier populations are visible in each panel.
Clustering Algorithms
K-means was applied to the standardised five-dimensional feature space. The optimal number of clusters was selected by computing the silhouette score for cluster counts from two to six and choosing the value that maximised the score; a value of two was optimal for all four clusters independently.
DBSCAN was applied to the same feature space. The neighbourhood radius parameter was optimised per cluster using the k-distance plot method, computing the distance to each point's fifth nearest neighbour, sorting in descending order, and identifying the elbow where the curve transitions from steep to flat. A sensitivity analysis was conducted testing radius values from 0.5 to 0.9 in steps of 0.1, with the selected value being the last value before all structure collapsed into a single cluster.

Figure 2: K-distance plot for Praesepe used to determine the optimal DBSCAN neighbourhood radius. The elbow at approximately 0.7 indicates the transition between dense cluster members and sparse outliers.
DBSCAN's density-based approach to discovering clusters in noisy spatial data follows the method introduced by Ester et al.[8]
A Gaussian Mixture Model was applied to the same feature space, with the number of components selected by fitting models with two through six components and choosing the value that minimised the Bayesian Information Criterion, which penalises model complexity to discourage unnecessary components. Five to six components were selected for all clusters.
A Self-Organising Map was trained using the minisom Python library[9] on the same standardised feature space. Grid size was set to 15 by 15 for all clusters. Training used 5,000 iterations with a Gaussian neighbourhood function, a learning rate of 0.5, and a sigma of 1.5. The unified distance matrix (U-matrix) was computed to visualise boundaries between distinct regions in the learned feature space, with dark regions indicating high inter-node distances corresponding to population boundaries.
Validation
Two independent validation approaches were used. First, PARSEC isochrone overlays[10] - theoretical stellar evolution models from the Padova group - were generated for each cluster at literature ages and solar metallicity, then overlaid on observed CMDs. Alignment between theoretical and observed sequences confirms distance calculations, membership cleaning, and age consistency. Second, silhouette scores were computed for the k-means results as a quantitative clustering quality metric.
Results
Colour-magnitude diagrams revealed a main sequence turn-off at an absolute magnitude of approximately +1 for Praesepe and approximately -4 for NGC 2516. White dwarf candidates were identified at a BP-RP colour of approximately -0.3 and an absolute magnitude of approximately 11 to 12 in multiple clusters. Giant and supergiant candidates in NGC 2516 were spontaneously detected above the main sequence at absolute magnitudes of approximately -4 to -2.

Figure 3: Four-cluster CMD overlay on a common axis. Praesepe (orange) shows a lower main sequence turn-off compared to the three younger clusters, consistent with its older age of approximately 700 Myr.
K-means clustering with two clusters was optimal for all four clusters independently, with silhouette scores ranging from 0.31 to 0.40 (Table 2). The two groups consistently separated upper and lower main sequence populations across all clusters.
Cluster | Optimal k | Silhouette Score |
Pleiades (M45) | 2 | 0.3369 |
Praesepe (M44) | 2 | 0.3073 |
NGC 2516 | 2 | 0.3310 |
Blanco 1 | 2 | 0.3953 |
Table 2: K-means optimal cluster count and silhouette scores for all four open clusters.

Figure 4: K-means clustering result for Praesepe (M44) with optimal k=2. Group 1 (orange) corresponds to the upper main sequence and turn-off stars; Group 0 (blue) corresponds to the lower main sequence and M-dwarf population.
DBSCAN clustering, applied with the neighbourhood radius optimised per cluster, revealed no strong discrete subpopulations in any cluster, with a single dominant group containing the majority of stars at all optimal radius values. This confirmed the main sequence as a continuous density structure rather than a set of discrete islands. Giant and supergiant candidates in NGC 2516 were identified as genuinely separated from the main cluster body, representing an unexpected detection.

Figure 5: DBSCAN clustering result for Praesepe (M44) at radius 0.7. Grey points indicate noise. The dominant Cluster 0 contains 703 of 921 stars, confirming the continuous nature of the main sequence structure.
Gaussian Mixture Model component selection identified five to six optimal components for all four clusters independently. Components mapped onto regions broadly consistent with distinct stellar mass regimes along the main sequence: upper main sequence turn-off stars, solar-type stars, K-type stars, M-dwarf populations, and an outlier component including white dwarf candidates.


Figure 6: GMM stellar population classification for all four open clusters. Components correspond to regions broadly consistent with distinct stellar mass regimes along the main sequence, from upper main sequence turn-off stars to M-dwarf populations.
A 15 by 15 Self-Organising Map grid was trained for each cluster, with node occupation rates of 96.4% to 100% across all clusters, confirming continuous stellar distribution in feature space with no discrete gaps. The U-matrix revealed one to two primary boundary regions per cluster, consistent with the upper/lower main sequence division identified by k-means. Colouring the CMD by Self-Organising Map node assignment showed gradual colour transitions along the main sequence, with white dwarf candidates and NGC 2516 giant stars assigned to unique isolated nodes distinct from the main sequence population.


Figure 7: SOM U-matrix for all four open clusters on a 15x15 grid. Dark regions indicate high inter-node distances corresponding to population boundaries in five-dimensional feature space.
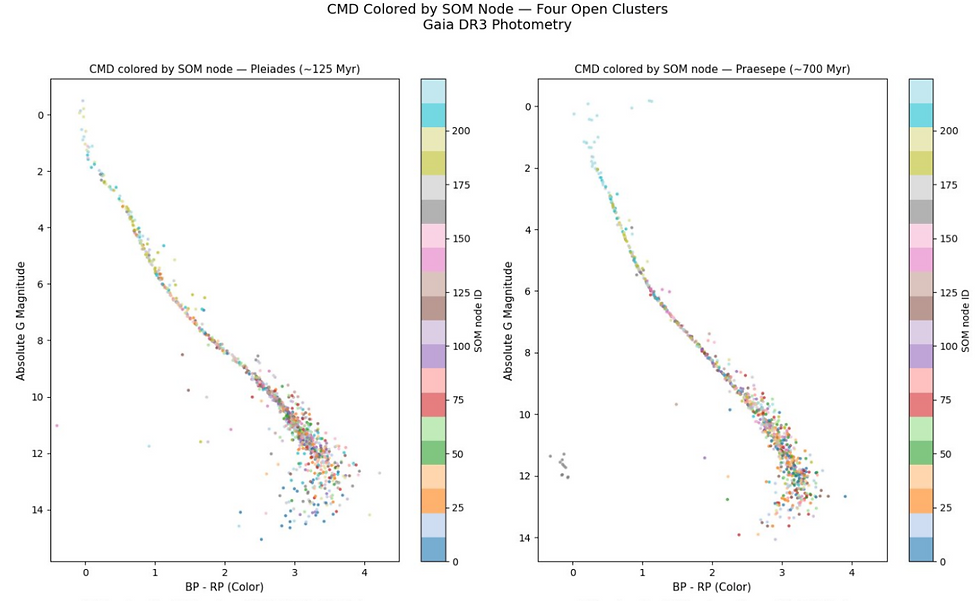
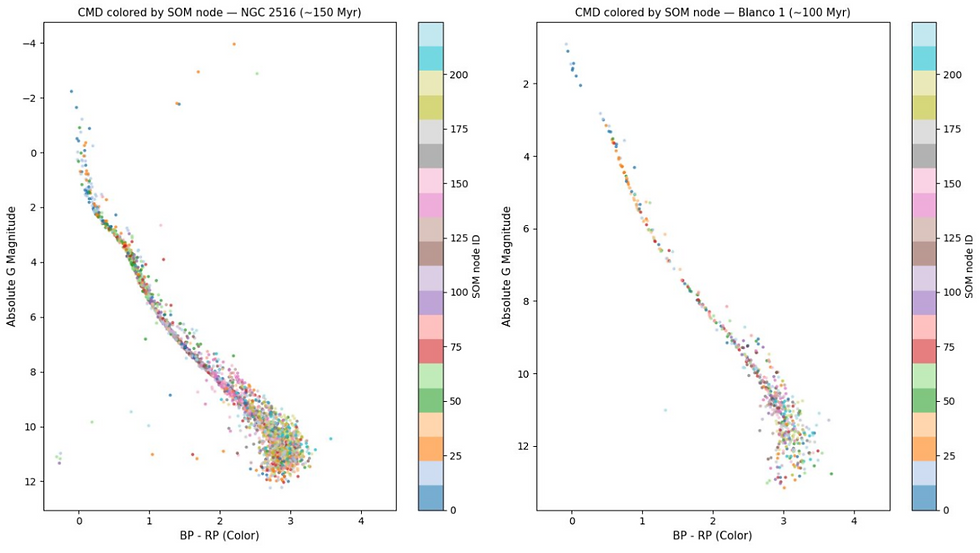
Figure 8: CMD coloured by SOM node assignment for all four clusters. Gradual colour transitions along the main sequence confirm continuous stellar population structure. Outlier stars including white dwarf candidates and NGC 2516 giant stars are assigned unique isolated nodes.
PARSEC isochrone overlays at literature ages and solar metallicity aligned with observed Gaia DR3 photometry for all four clusters, independently confirming pipeline accuracy, membership cleaning validity, and age consistency with published values. Parallax-derived distances matched literature values to within 3% across all clusters.


Figure 9: PARSEC isochrone overlays at literature ages for all four clusters. Black curves show theoretical stellar evolution models at solar metallicity. Alignment between observed Gaia DR3 photometry and theoretical isochrones confirms pipeline accuracy and age consistency with published values.
Discussion
Age-Dependent Main Sequence Turn-off
The main sequence turn-off is the point on the colour-magnitude diagram where stars abandon hydrogen core burning and evolve toward the giant branch. This occurs because more massive stars consume hydrogen more rapidly through higher core temperatures and pressures, exhausting their fuel sooner than lower-mass stars despite their larger reserves. When a star's core hydrogen is depleted, it can no longer maintain pressure balance against gravity through fusion, causing it to expand and cool into a giant. More massive stars therefore leave the main sequence first, progressively removing the brightest, bluest stars from the upper CMD as a cluster ages. The substantial difference in turn-off position between Praesepe (approximately 700 Myr) and NGC 2516 (approximately 150 Myr) directly reflects this mass-dependent evolutionary timescale. Recovering this age signature from photometry and astrometry alone, without spectroscopic temperature or metallicity measurements, demonstrates that Gaia's combined astrometric and photometric data contains sufficient information to reconstruct stellar evolutionary history through unsupervised methods, supporting the broader goal of automated large-scale cluster analysis where spectroscopic follow-up is observationally infeasible.
Spontaneous Detection of Evolved Stellar Populations
Giant stars are expected in NGC 2516 specifically because its age of approximately 150 Myr places it at a critical evolutionary stage, in which its most massive surviving members are exhausting their core hydrogen and expanding into giants. White dwarfs were found across multiple clusters, including the older Praesepe, because they represent the end state of intermediate-mass stars that have already completed their full evolutionary cycle and cooled into degenerate cores. Neither the membership filtering pipeline nor the clustering algorithms were designed or tuned to identify these populations; they emerged as natural by-products of the automated workflow without any targeted search, suggesting that the same approach applied to a larger cluster sample could systematically catalogue such populations across the Gaia archive without specialised detection pipelines for each stellar class.
Method Disagreement as a Scientific Finding
The four clustering algorithms produced different quantitative results: k-means identified two groups, the Gaussian Mixture Model resolved five to six components, DBSCAN found one dominant structure with noise, and the Self-Organising Map revealed continuous topology with one to two boundary regions. This disagreement is not a failure of the methods, but reflects the different mathematical properties each algorithm is sensitive to. K-means partitions space by minimising distances to centroids, making it sensitive to the most prominent density contrast in the data. DBSCAN identifies density-connected regions, finding that the main sequence is one continuous high-density structure with no internal gaps large enough to constitute separate clusters. The Gaussian Mixture Model fits overlapping distributions, resolving finer probabilistic substructure that k-means cannot detect with hard boundaries. The Self-Organising Map maps the global topology of the data, revealing the continuous nature of the distribution while identifying the sharpest gradient boundaries. Together these perspectives suggest that no single algorithm is sufficient for characterising open cluster stellar populations, and that a multi-method approach is necessary to distinguish genuine discrete subpopulations from continuous mass gradients.
Limitations
This study has three principal data limitations. The absence of spectroscopic measurements limits the ability to distinguish blue stragglers from genuine upper main sequence stars and to separate metallicity-driven scatter from age-driven scatter. The four-cluster sample is sufficient to demonstrate the pipeline's capabilities but insufficient to draw statistically robust conclusions about open clusters as a population; a sample of twenty to fifty clusters would be required for universally applicable results. Unresolved binary stars, which appear brighter than single stars of the same colour, were not filtered and likely contribute scatter to the feature space. Two methodological limitations are also notable: the DBSCAN radius parameter must be tuned per cluster and small changes produce substantially different cluster counts, and Gaussian Mixture Models tend to produce spatially incoherent components in high-dimensional feature spaces.
Conclusion
This study applied four unsupervised machine learning algorithms to Gaia DR3 photometry and astrometry for 5,409 confirmed members across four open clusters spanning a seven-fold age range, forming a fully automated stellar population classification pipeline validated by PARSEC isochrone overlays. The pipeline recovered an age-dependent main sequence turn-off progression across all four clusters, spontaneously detected giant, supergiant, and white dwarf candidates without targeted searches, and revealed genuine density discontinuities in five-dimensional feature space through Self-Organising Map analysis, with all findings consistent across four independent algorithmic approaches. These results demonstrate that unsupervised machine learning applied to Gaia photometry and astrometry alone, without spectroscopic data or manual expert intervention, is capable of recovering physically meaningful stellar evolutionary structure. The fully automated and replicable nature of the pipeline positions it as a foundation for large-scale systematic stellar population analysis across the thousands of open clusters cataloged in the Gaia archive.
Funding Statement / Acknowledgements
This research received no external funding. This research made use of data from the European Space Agency Gaia mission, processed by the Gaia Data Processing and Analysis Consortium. Data analysis was performed using astroquery, scikit-learn, and minisom. PARSEC isochrones were obtained from the Padova stellar evolution database.
References
1. Cantat-Gaudin, T., et al. “A Gaia DR2 view of the open cluster population in the Milky Way.” Astronomy & Astrophysics 618 (2018): A93.
2. Hunt, Emily L., and Sabine Reffert. “Improving the open cluster census. II. An all-sky cluster catalogue with Gaia DR3.” Astronomy & Astrophysics 673 (2023): A114.
3. Gaia Collaboration, Vallenari, A., et al. “Gaia Data Release 3. Summary of the content and survey properties.” Astronomy & Astrophysics 674 (2023): A1.
4. Alfonso, Jeison, and Alejandro García-Varela. “A Gaia astrometric view of the open clusters Pleiades, Praesepe, and Blanco 1⋆” Astronomy & Astrophysics 677 (2023): A163.
5. Phelps, Randy L., Kenneth A. Janes, and Kent A. Montgomery. “Development of the Galactic Disk: A Search for the Oldest Open Cluster” Astronomical Journal 107 (1994): 1079.
6. Raja, Mudasir, Priya Hasan, Md Mahmudunnobe, Md Saifuddin, and S. N. Hasan. “Membership determination in open clusters using the DBSCAN clustering algorithm.” Astronomy and Computing (2024). https://arxiv.org/abs/2404.10477.
7. Kohonen, Teuvo. “Self-organized formation of topologically correct feature maps.” Biological Cybernetics 43, no. 1 (1982): 59–69.
8. Martin Ester, Hans-Peter Kriegel, Jörg Sander, and Xiaowei Xu. “A density-based algorithm for discovering clusters in large spatial databases with noise.” Proceedings of the Second International Conference on Knowledge Discovery and Data Mining (1996): 226–231.
9. Vettigli, Giuseppe. “MiniSom: minimalistic and NumPy-based implementation of the Self Organizing Map.” GitHub repository (2013). https://github.com/JustGlowing/minisom.
10. Bressan, Alessandro, Paola Marigo, Léo Girardi, et al. “PARSEC: stellar tracks and isochrones with the PAdova and TRieste Stellar Evolution Code.” Monthly Notices of the Royal Astronomical Society 427 (2012): 127.
About the Author

Nischal Shah is an 18-year-old independent researcher from Dharan, Nepal. He has competed in the Chemistry Olympiad and the Astronomy & Astrophysics Olympiad, and has self-directed technical experience spanning C, web development, and Python. This study was conducted independently, without institutional affiliation or academic supervision, using publicly available Gaia DR3 data and open-source machine learning tools.

Comments